In this problem the student is supposed to address some claims about tangents and function and to provide graphs which support his answers. In general student can use 1 method of adding a tangent line (by adding a straight line which is movable and with adjustable slope) and 2 methods of adding a function:
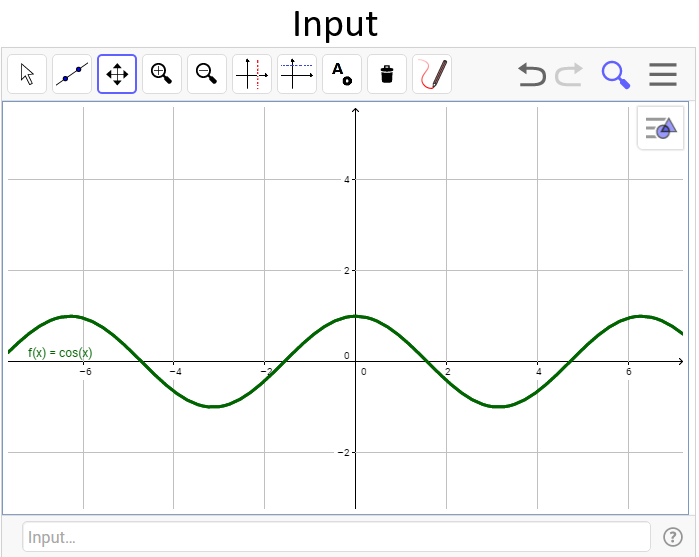
- Input: by adding a mathematical function which will be graphically presented by Geogebra applet.
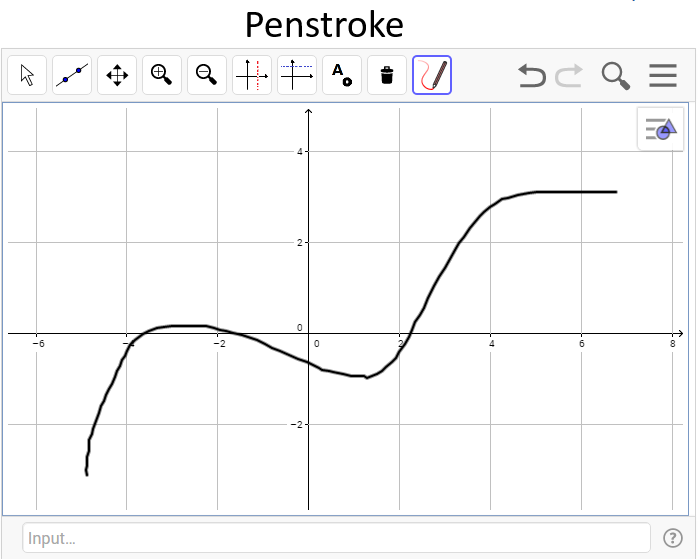
- Penstroke: by drawing a line on the graph.


Because we have to assume that in most cases students won’t provide an answer which is 100% mathematically correct even when using the input method (tangent line doesn’t touch the function, the slope of the line isn’t the same as the slope of the actual tangent at this point etc.) and there are a lot of students who prefer to use the penstroke method we had to find a way to find and identify a tangent point in a way which will include the vast majority of possible variations of answers which are acceptable and that indicate the students’ understanding.
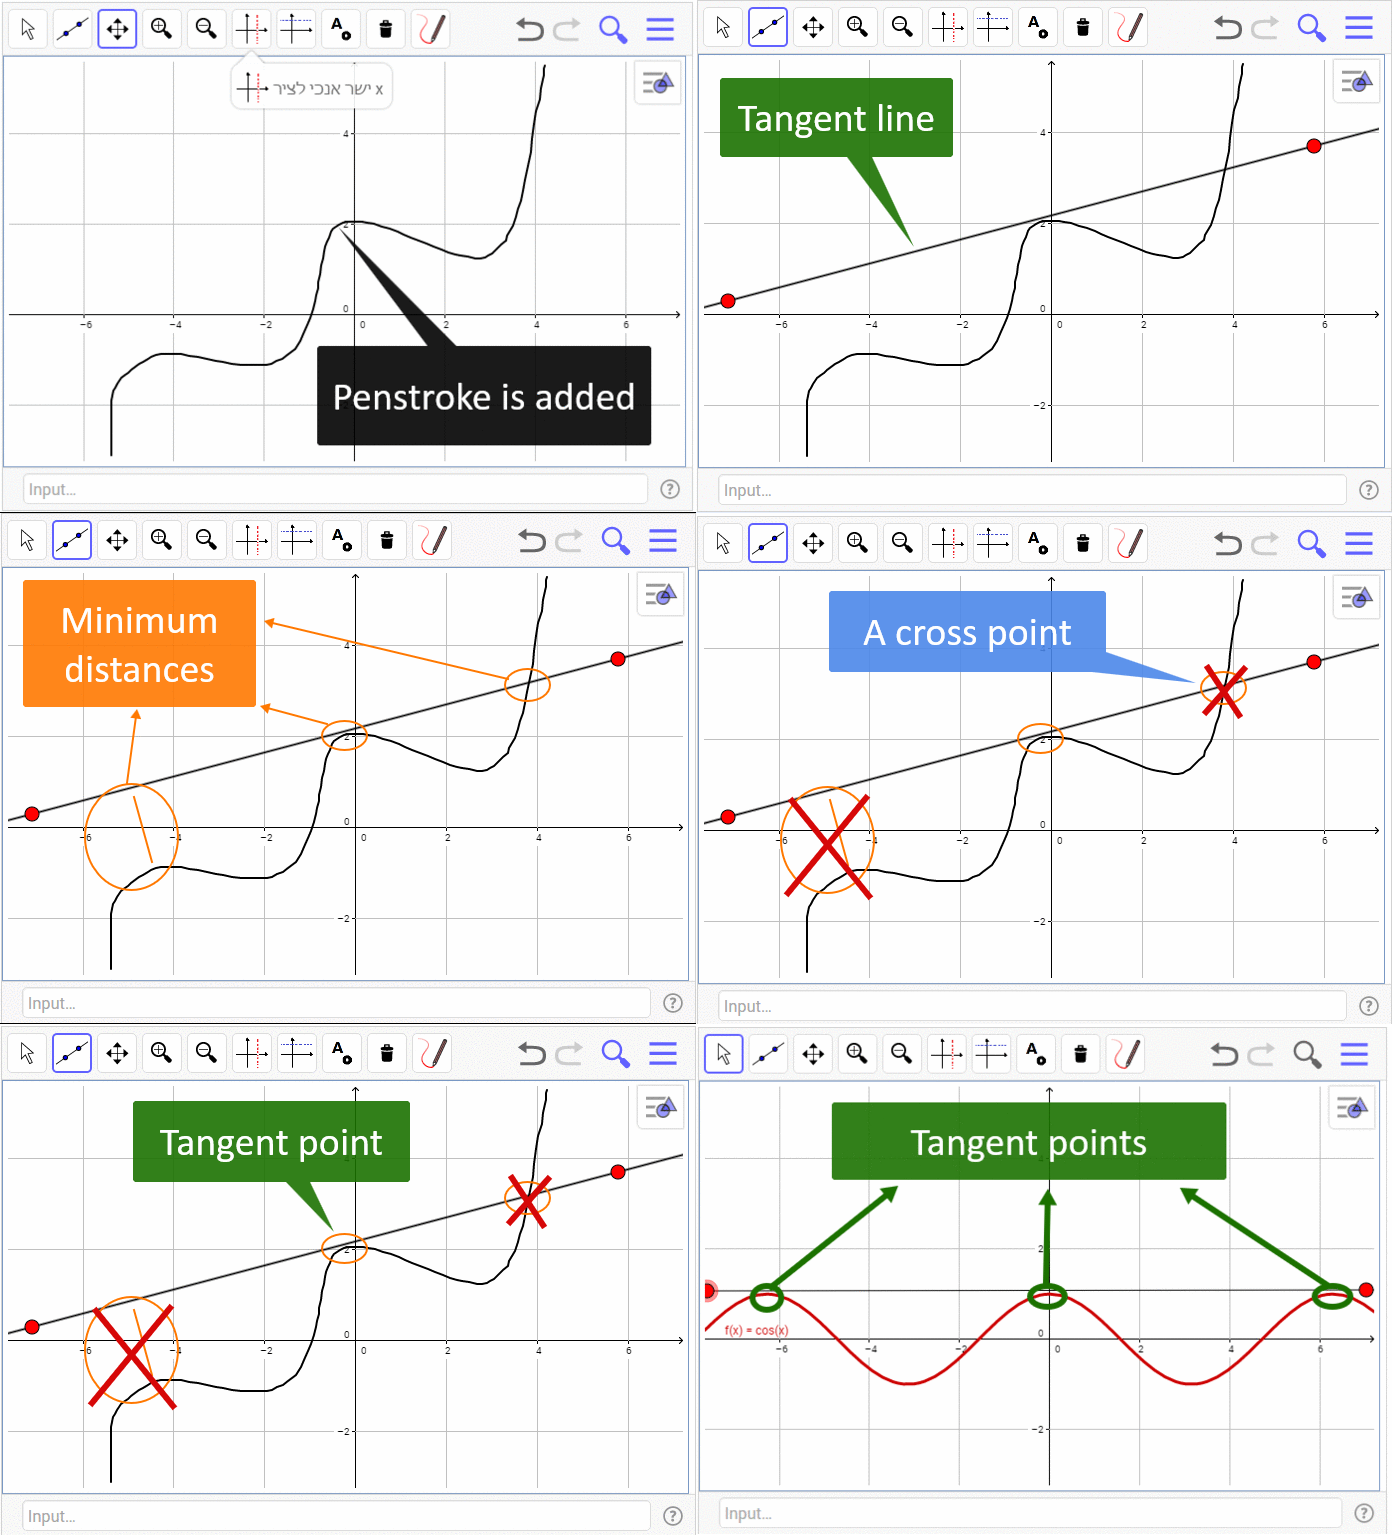
In order to do that we’ve created a method that works as follows:
- We get an array of coordinates of the function input/penstroke.
- We re-order this array from the smallest x to the largest.
- We create an array of distances between the coordinates and the tangent line (using a Geogebra function) – in the same order as 2
- We create a list of suspected tangents point by finding all the minimum distances (before and after there is a greater distance.
- We roll out the following groups:
- Distances less then x (0.2 in our case), an acceptable distance which is still close enough to be counted as a tangent point.
- Distances at cross points.
- Minimum distances which are very close to each other are counted as one.

From the list of distances that is left we can find the actual coordinates of the tangent points, count how many there are and give their exact coordinates.